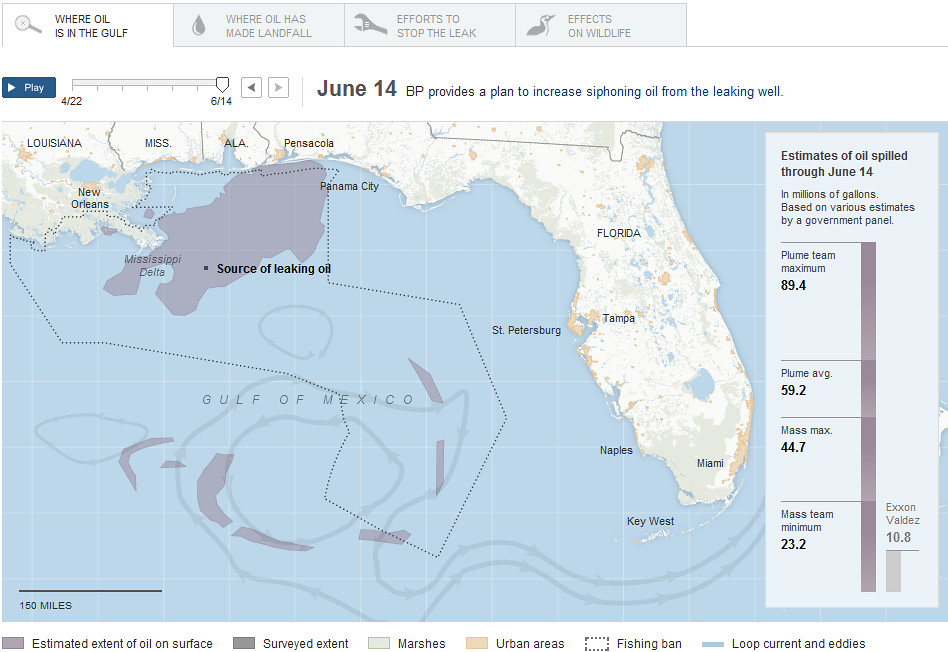
Via liberal rag the New York Times, comes this interactive graphic about the oil spill. Included are time lapse representations of the size, volume, and area of the oil spill,
landfall areas and boom setups, diagrams of how
efforts to stop the leak (HAH!) would go, and all kinds of
wildlife that won't exist anymore.
It's quite well put together.


No comments:
Post a Comment