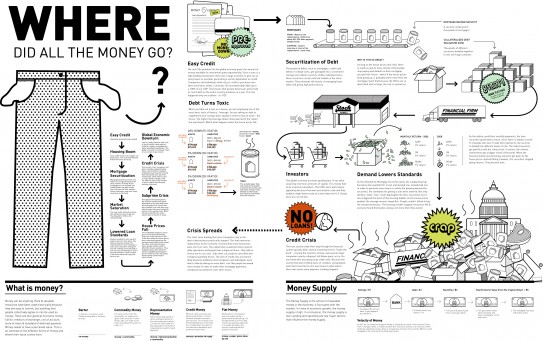
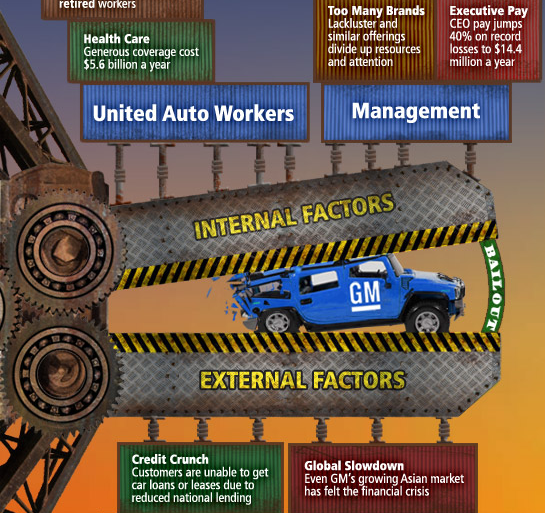

For those of us who have trouble understanding things unless cartoon pictures, charts, and sizes of things that are then compared to the sizes of other things, Flowing Data has collected together 27 visualizations and infographics to better help us understand why we have no money, no job, and daddy is drinking again.


No comments:
Post a Comment